Origami’s Dashboards
Unlock the Power of Data with Origami Dashboards
Origami.ms Dashboards provide a dynamic, real-time view of your data, empowering teams with actionable insights at a glance. Designed for flexibility, efficiency, and ease of use, these dashboards help organizations visualize key metrics and track progress effortlessly.
Tailored Visualizations for Every Need
With a variety of powerful widgets, Origami.ms Dashboards enable users to create clear and insightful data representations. Choose from:
- Tables & Sorted Tables – Display structured data with the ability to reorder rows easily.
- KPI Widgets – Monitor key performance indicators with multiple query options for deeper insights.
- External Widgets – Seamlessly integrate external data via custom URLs.
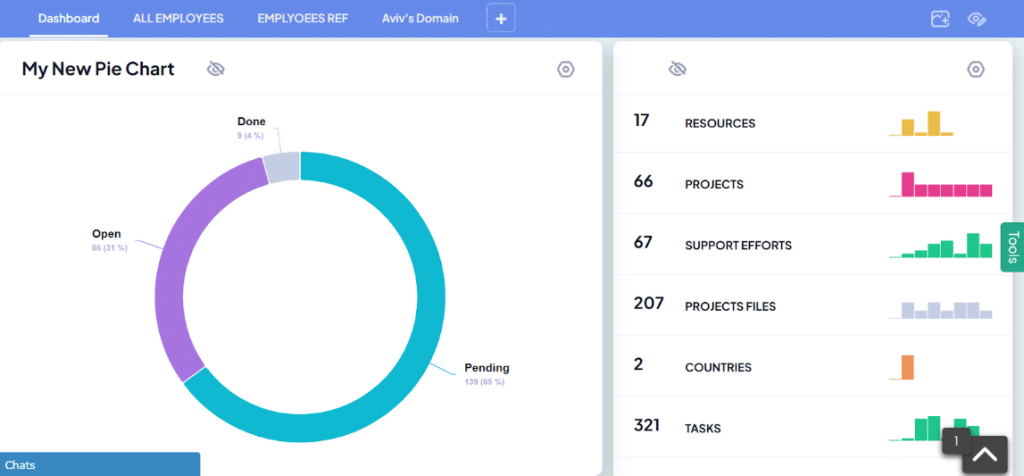
- Pie Charts, Bar Charts & Trend Graphs – Gain instant visual clarity on your most critical metrics.
- Funnel & Speedometer Widgets – Track process efficiency and performance trends.
Instance Counters & Instance Graphs – Get a snapshot of entity counts with historical trends.

Real-Time Data Updates
Stay up to date with instant updates in table widgets and frequent refresh rates for charts and visual elements. This ensures that decision-making is always based on the most recent data available.
Unlock the Power of Data with Origami Dashboards
Origami.ms Dashboards provide a dynamic, real-time view of your data, empowering teams with actionable insights at a glance. Designed for flexibility, efficiency, and ease of use, these dashboards help organizations visualize key metrics and track progress effortlessly.
Tailored Visualizations for Every Need
With a variety of powerful widgets, Origami.ms Dashboards enable users to create clear and insightful data representations. Choose from:
- Tables & Sorted Tables – Display structured data with the ability to reorder rows easily.
- KPI Widgets – Monitor key performance indicators with multiple query options for deeper insights.
- External Widgets – Seamlessly integrate external data via custom URLs.
- Pie Charts, Bar Charts & Trend Graphs – Gain instant visual clarity on your most critical metrics.
- Funnel & Speedometer Widgets – Track process efficiency and performance trends.
Instance Counters & Instance Graphs – Get a snapshot of entity counts with historical trends.

Real-Time Data Updates
Stay up to date with instant updates in table widgets and frequent refresh rates for charts and visual elements. This ensures that decision-making is always based on the most recent data available.